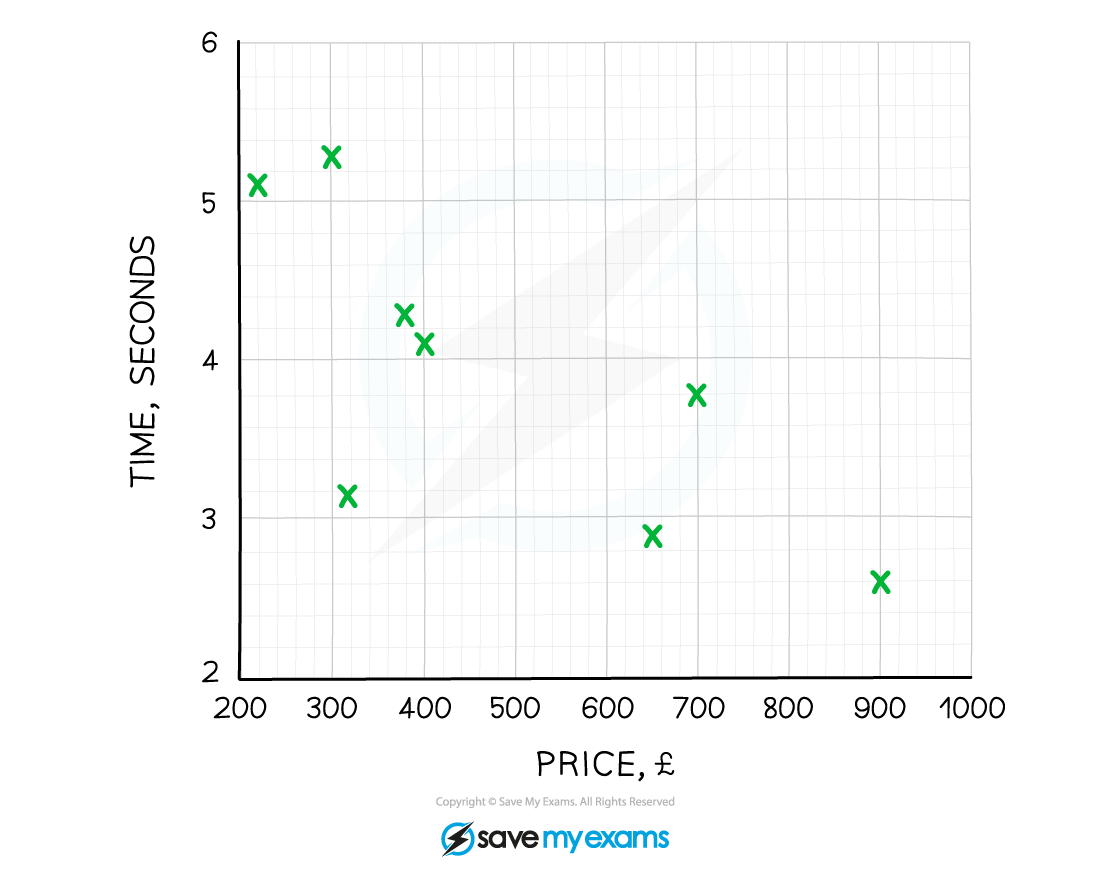


Sophie is investigating the price of computers to see if the more they cost, the quicker they are.
She tests 8 computers and runs the same program on each, measuring how many seconds each takes to complete the program. Sophie's results are shown in the table below.
| Price (£) | 320 | 300 | 400 | 650 | 250 | 380 | 900 | 700 |
| Time (secs) | 3.2 | 5.4 | 4.1 | 2.8 | 5.1 | 4.3 | 2.6 | 3.7 |
Draw a scatter graph to show this information.
Draw the points carefully and accurately as to not miss any out.
Describe the correlation and explain what this means in terms of the question.
As we are asked to explain what the correlation means in terms of the question we need to mention the connection between cost and speed.
The graph shows negative correlation
This means that the more a computer costs, the quicker it is at running the program
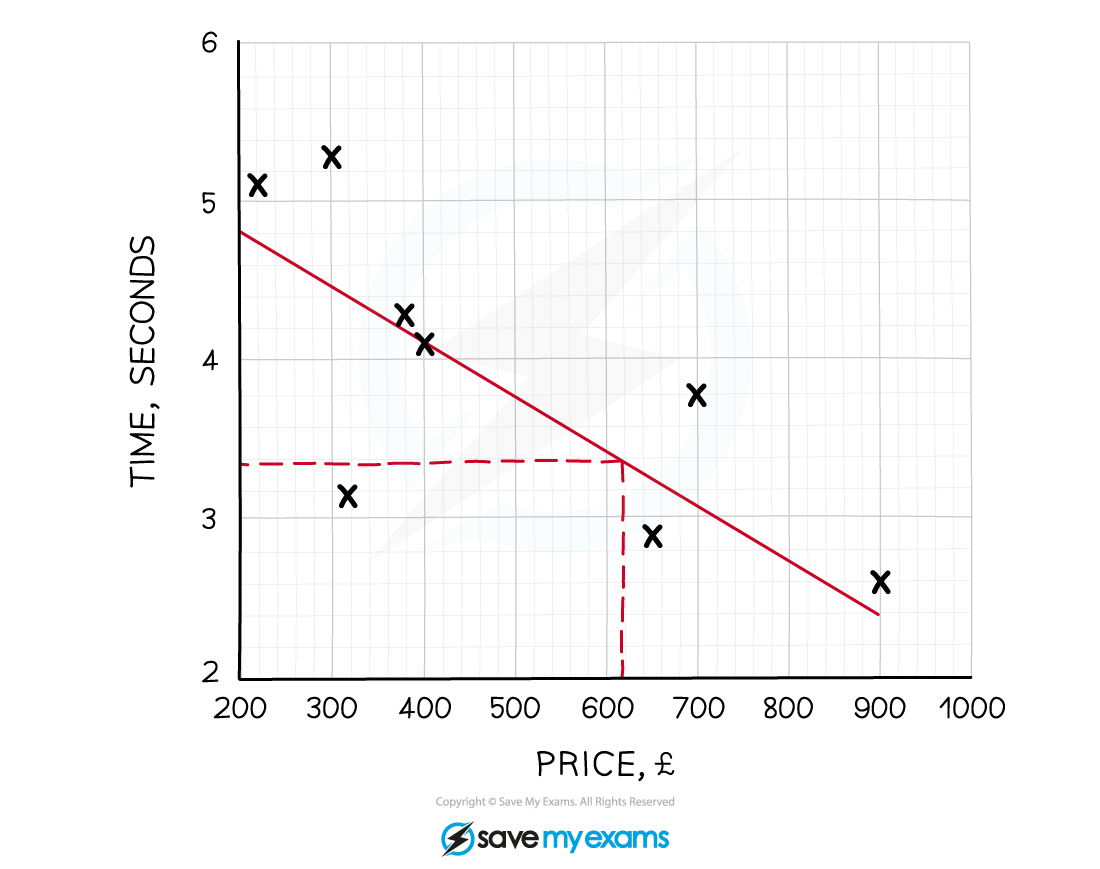
Showing your method clearly, estimate the price of a computer that completes the task in 3.5 seconds.
First draw a line of best fit, by eye.

Draw a horizontal line from 3.5 on the time axis until it hits the line of best fit, then draw a vertical line down to the price axis and take a reading.
The price of a computer taking 3.5 seconds to run the program should cost around £612
Due to possible difficulties of reading an exact value a range of answers will be acceptable