Top Rated by Parents/Students Nationwide

Scatter Graphs

Correlation

What is correlation?

  • Correlation is a way of describing the way two quantities are related to each other
    • You may see this referred to as linear correlation
    • The word linear will not appear in an exam question
  • Correlation can be one of three types
    • Positive correlation
      • This is where one quantity increases as the other quantity increases
      • Examples
        As the temperature increases, the sales of cold drinks increase
        As the age of a tree increases, its height increases
    • Negative correlation
      • This is where one quantity decreases as the other quantity increases
      • Examples
        The age of a car and its value
        The amount of daylight hours and the time spent indoors
    • No correlation
      • This is where there is no apparent relationship between the two quantities
      • Examples
        The batting average of a cricketer and the cost of a pint of milk
        The amount of time spent playing computer games and the weight of an elephant
  • For positive and negative correlation, the strength of the correlation may be described
    • weak correlation
    • strong correlation
    • these terms should be self-explanatory!
  • Note in some cases, a correlation might not be true all the time
    • For example, a tree will reach an age where it is fully grown and it's height no longer increase
  • There could also be exceptions to quantities that have correlation
    • For example, an old, but rare, sports car may be worth a lot of money

What does the phrase "correlation doesn't mean causation" mean?

  • Correlation only refers to whether two quantities are linked by the way their values increase or decrease
  • It does not necessarily mean they are linked in real-life
    • One quantity increasing or decreasing does not cause the other quantity to increase or decrease
    • e.g. the volume of cheese eaten by a population and the number of marriages in that population
      • both could be increasing but an increase in the volume of cheese eaten does not cause people to get married
  • It could be that the two quantities are not linked in real-life but can appear linked due to a third quantity - usually time
    • e.g. the height of a sunflower and the weight of a puppy
      • the height of a sunflower does not cause the weight of a puppy to change!
      • but both generally increase with time

Scatter Graphs

What is a scatter graph?

  • Scatter graphs are used to quickly see if there is a connection (correlation) between two pieces of data
    • For example a teacher may want to see if there is a link between grades in mathematics tests and grades in physics tests
  • You may also come across scatter plots or scatter diagrams
    • these are the same as scatter graphs

What do scatter graphs look like?

  • For each data pair, points are plotted
    • they are not joined up!
    • points are 'scattered' around the diagram
  • The general shape the points form indicate the type of correlation they are showing

Positive Correlation, IGCSE & GCSE Maths revision notesScatter Graphs Example 3, IGCSE & GCSE Maths revision notesNo Correlation, IGCSE & GCSE Maths revision notes

How do I draw a scatter graph?

  • This is simply a matter of plotting points - usually from a table of values
    • be very careful which way round you are plotting them
    • this is particularly important when values are very similar

Line of Best Fit

What is a line of best fit?

  • If a scatter graph suggests there is a positive or negative correlation
    • a line of best fit can be drawn on the scatter graph
      • this can then be used to predict one data value from the other
        e.g. we can use the physics grade for a student to predict their maths grade

How do I draw a line of best fit?

  • line of best fit can be drawn by eye
    • it does not have to pass through any particular point(s)
      • however, in some cases it would make sense that it is drawn through the origin
        e.g. the height and weight of a kitten
    • there should roughly be as many points on one side of the line as the other
    • the spaces between the points and the line should roughly be the same on either side
  • The 'closeness' of the plotted points to a line of best fit can be described by the strength of the correlation
    • a weak correlation would have many points with a fair amount of space between =them and the line of best fit
    • a strong correlation would have many points close, or even on, the line of best fit

How do I use a line of best fit?

  • The line of best fit can be used to predict the value of one variable from the other variable
    • Predictions should only be made for values that are within the range of the given data
    • Making a prediction within the range of the given data is called interpolation
    • Making a prediction outside of the range of the given data is called extrapolation and is much less reliable
    • The prediction will be more reliable if the number of data values in the original sample set is bigger

Exam Tip

  • Watch out for outliers on scatter graphs
    • these are rogue results or values that do not follow the general pattern of the data/graph
    • you should ignore these points when judging where to draw your line of best fit
    • you'll usually only see one of these in a question, if any

Worked example

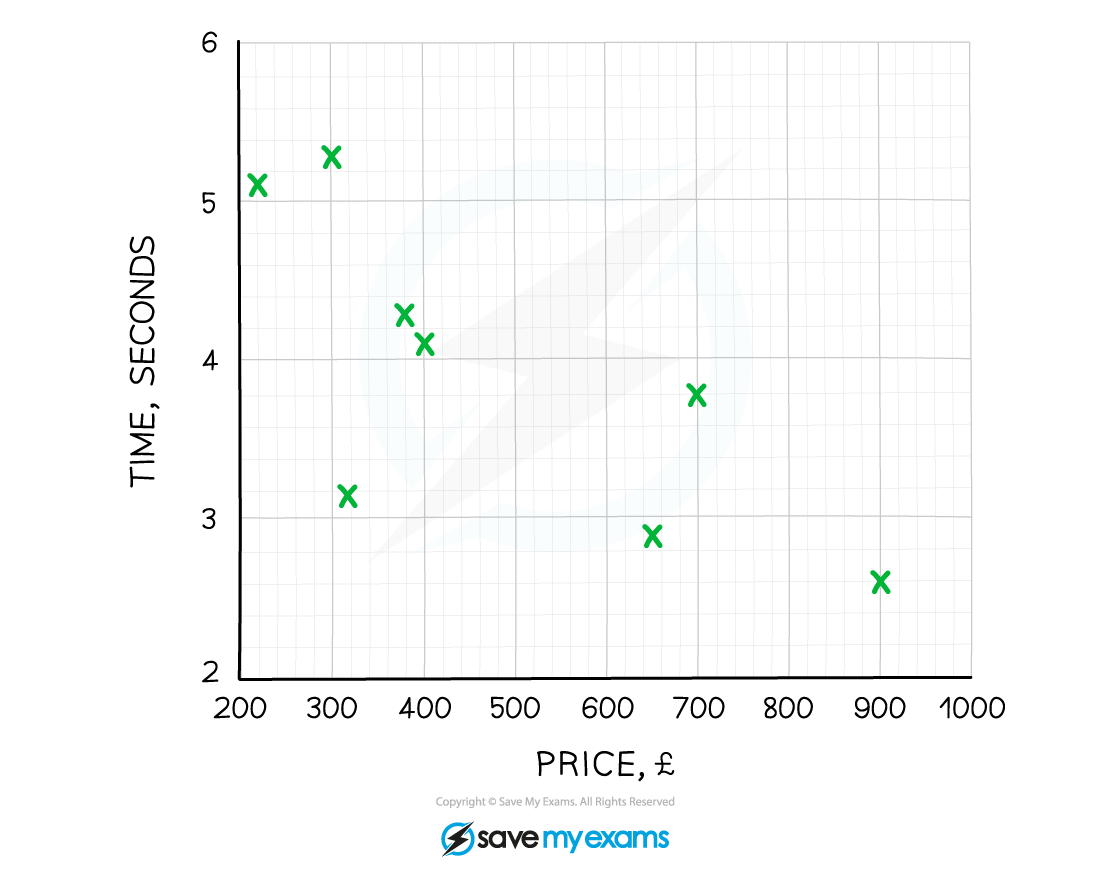
Sophie is investigating the price of computers to see if the more they cost, the quicker they are.
She tests 8 computers and runs the same program on each, measuring how many seconds each takes to complete the program.  Sophie's results are shown in the table below.

Price (£) 320 300 400 650 250 380 900 700
Time (secs) 3.2 5.4 4.1 2.8 5.1 4.3 2.6 3.7

(a)

Draw a scatter graph to show this information.

Draw the points carefully and accurately as to not miss any out.SG3 Time Price, IGCSE & GCSE Maths revision notes
 

(b)

Describe the correlation and explain what this means in terms of the question.

As we are asked to explain what the correlation means in terms of the question we need to mention the connection between cost and speed.

The graph shows negative correlation
This means that the more a computer costs, the quicker it is at running the program


(c)

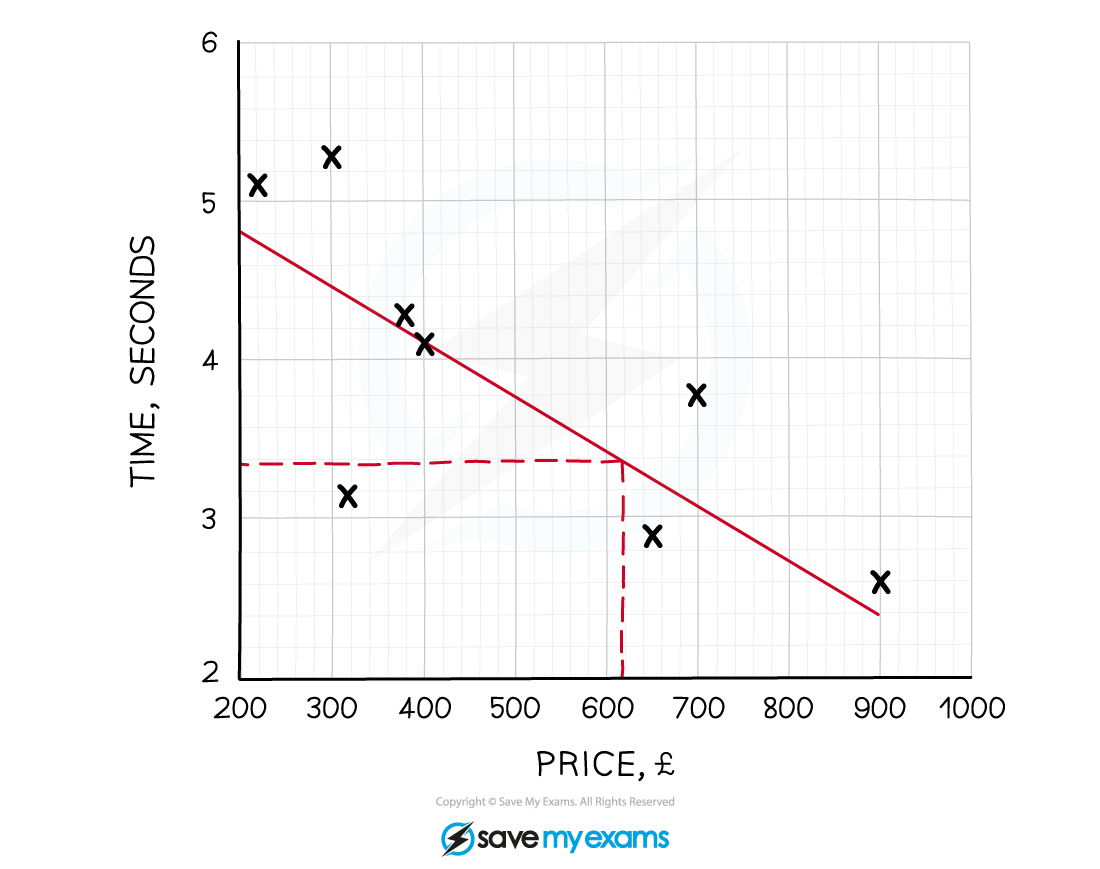
Showing your method clearly, estimate the price of a computer that completes the task in 3.5 seconds.

First draw a line of best fit, by eye.
SG4 Line of best fit, IGCSE & GCSE Maths revision notes

Draw a horizontal line from 3.5 on the time axis until it hits the line of best fit, then draw a vertical line down to the price axis and take a reading.

The price of a computer taking 3.5 seconds to run the program should cost around £612

Due to possible difficulties of reading an exact value a range of answers will be acceptable

Number Toolkit
  • Mathematical Operations
  • Negative Numbers
  • Money Calculations
  • Number Operations
  • Related Calculations
  • Counting Principles
Prime Factors, HCF & LCM
  • Types of Number
  • Prime Factor Decomposition
  • HCF & LCM
Powers, Roots & Standard Form
  • Powers, Roots & Indices
  • Standard Form
Fractions
  • Basic Fractions
  • Operations with Fractions
Percentages
  • Basic Percentages
  • Working with Percentages
Simple & Compound Interest, Growth & Decay
  • Interest & Depreciation
  • Exponential Growth & Decay
Fractions, Decimals & Percentages
  • Converting between FDP
  • Converting between FDP
Rounding, Estimation & Bounds
  • Rounding & Estimation
  • Bounds
Surds
  • Simplifying Surds
  • Rationalising Denominators
Using a Calculator
  • Using a Calculator
Algebra Toolkit
  • Algebraic Notation & Vocabulary
  • Algebra Basics
Algebraic Roots & Indices
  • Algebraic Roots & Indices
Expanding Brackets
  • Expanding Single Brackets
  • Expanding Multiple Brackets
Factorising
  • Factorising
  • Factorising Quadratics
  • Quadratics Factorising Methods
Completing the Square
  • Completing the Square
Rearranging Formulae
  • Rearranging Formulae
Algebraic Proof
  • Algebraic Proof
Linear Equations
  • Solving Linear Equations
Solving Quadratic Equations
  • Solving Quadratic Equations
  • Quadratic Equation Methods
Simultaneous Equationsr
  • Simultaneous Equations
Iteration
  • Iteration
Forming & Solving Equations
  • Forming Equations
  • Equations & Problem Solving
Functions
  • Functions Toolkit
  • Composite & Inverse Functions
Coordinate Geometrys
  • Coordinates
  • Coordinate Geometry
Linear Graphs y = mx + c
  • Straight Line Graphs (y = mx + c)
  • Parallel & Perpendicular Lines
Graphs of Functions
  • Types of Graphs
  • Graphical Solutions
  • Trig Graphs
Equation of a Circle
  • Equation of a Circle
  • Equation of a Tangents
Estimating Gradients & Areas under Graphs
  • Finding Gradients of Tangents
  • Finding Areas under Graphs
Real-Life Graphs
  • Distance-Time & Speed-Time Graphs
  • Conversion Graphs
  • Rates of Change of Graphs
Solving Inequalities
  • Solving Linear Inequalities
  • Conversion Graphs
  • Solving Quadratic Inequalities
Graphing Inequalities
  • Graphing Inequalities
Transformations of Graphs
  • Reflections of Graphs
Sequences
  • Introduction to Sequences
  • Types of Sequences
  • Linear Sequences
  • Quadratic Sequences
Ratio Toolkit
  • Simple Ratio
  • Working with Proportion
Ratio Problem Solving
  • Ratios & FDP
  • Multiple Ratios
Direct & Inverse Proportions
  • Direct & Inverse Proportion
Standard & Compound Units
  • Time
  • Unit Conversions
  • Compound Measures
Exchange Rates & Best Buys
  • Exchange Rates & Best Buys
Geometry Toolkit
  • Symmetry
  • 2D & 3D Shapes
  • Plans & Elevations
Angles in Polygons & Parallel Lines
  • Basic Angle Properties
  • Angles in Polygons
  • Angles in Parallel Lines
Bearings, Scale Drawing, Constructions & Loci
  • Bearings
  • Scale & Maps
  • Constructing Triangles
  • Constructions & Loci
Circle Theorems
  • Angles at Centre & Semicircles
  • Chords & Tangents
  • Cyclic Quadrilaterals
  • Segment Theorems
  • Circle Theorem Proofs
Area & Perimeter
  • Area & Perimeter
  • Problem Solving with Areas
Circles, Arcs & Sectors
  • Area & Circumference of Circles
  • Arcs & Sectors
Volume & Surface Area
  • Volume
  • Surface Area
Congruence, Similarity & Geometrical Proof
  • Congruence
  • Similarity
  • Geometrical Proof
Area & Volume of Similar Shapes
  • Similar Area & Volumes
Right-Angled Triangles – Pythagoras & Trigonometry
  • Pythagoras Theorem
  • Right-Angled Trigonometry
  • Exact Trig Values
Sine, Cosine Rule & Area of Triangles
  • Sine & Cosine Rules
  • Area of a Triangle
  • Applications of Trigonomet
3D Pythagoras & Trigonometry
  • 3D Pythagoras & Trigonometry
Vectors
  • Introduction to Vectors
  • Working with Vectors
Transformations
  • Translations
  • Reflections
  • Rotations
  • Enlargements
  • Combination of Transformations
Probability Toolkit
  • Basic Probability
  • Relative & Expected Frequency
Simple Probability Diagrams
  • Two Way Tables
  • Frequency Trees
  • Set Notation & Venn Diagrams
Tree Diagrams
  • Tree Diagrams
Combined & Conditional Probability
  • Combined Probability
  • Conditional Probability
  • Combined Conditional Probabilities
Statistics Toolkit
  • Mean, Median & Mode
  • Averages from Tables
  • Range & Quartiles
  • Comparing Distributions
  • Population & Sampling
Statistical Diagrams
Histograms
  • Histograms
Cumulative Frequency & Box Plots
  • Cumulative Frequency Diagrams
  • Box Plots
Scatter Graphs & Correlation